The IABNZ’s refreshed internet ad report for the first half of 2017 shows desktop leading the way, while mobile remains slow but steady. Interactive ad revenue reached $431.1 million, and is heading towards $996m for the full year.
The IAB survey is conducted independently by Staples Rodway each quarter. The results reported are considered the most accurate measurement of online advertising revenues since the data is compiled directly from information supplied by companies selling advertising online.
All-inclusive, the report includes data reflecting online advertising revenues from websites, commercial online services, as well as other companies selling online advertising.
New format and process
The interactive sector has evolved rapidly over recent years, and the IAB has now launched a new format of the report which offers more comprehensive and relevant insights into the current digital media landscape.
Devices and Channels
The new report filters revenue by device-type, that is, by mobile, desktop and tablet. An ‘Other’ category has also been included to capture revenue associated with smart TV apps, gaming consoles, wearables etc.
Each device-category is broken down into channels including general display; video, audio; sponsorship and native.
Programmatic Advertising revenue figures are now sourced from Standard Media Index (SMI). The reported revenue reflects the value of actual placements as reported by Agency Trading Desk bookings and bookings onto independent DSPs.
Social Media and Search collection methodologies remain the same as per the previous reporting process and are reported separately. These figures are not included in the device and channel analysis.
Year-on-year comparisons
The IAB says it’s important to note – given the change in collection and formatting methodologies – the new report is unable to reflect year-on-year variances.
H1 2017 revenue
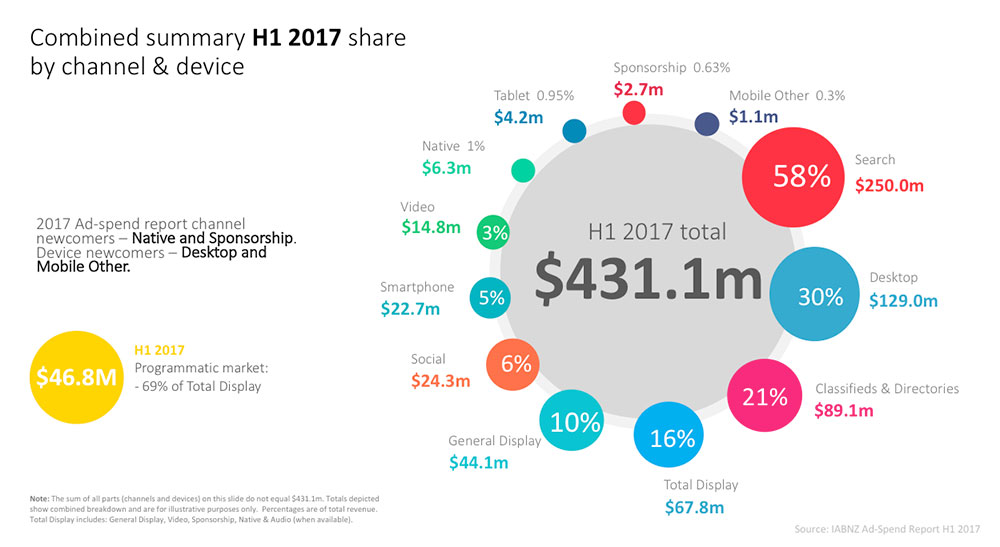
Interactive Advertising (ads viewed on a desktop PC, laptop or mobile device and accessed via an internet connection, 3G, 4G or wifi) reported over the first half of 2017 reached $431.1m.
Desktop leads the way…
Thirty percent ($129m) of Display, Classified and Directories revenue is served on desktop devices while the total of mobile devices (smartphone, tablet and other) generated $27.9m, 6.5% of revenue across these three channels.
Smartphone revenue reached $22.7m or 5% of total revenue. This number excludes Search and when compared with the same definition in Australia, NZ Smartphone revenue significantly lags where Mobile currently grabs 17% share of total interactive revenue.
Channel performance
Across all devices, Display advertising revenue landed at $67.8m with general Display advertising hit $44.1m (10% of revenue). Video remained buoyant generating $14.8m over the period.
For the first time the report is able to isolate Sponsorship and Native advertising with the former reaching just short of the $2.7m mark and the latter producing $6.3m in the first six months of 2017. Native advertising is one of the fastest growing advertising sectors overseas and it will be fascinating to see how this category fares in the future in NZ.
Programmatic now 69% of Display Revenue
Programmatic Revenue in the first half realized $46.8m which equates to 69% of total display advertising. This places NZ’s performance in this area in line with overseas markets including the US, Australia and UK.
Search and Social Media
The new report features the Search category on its own for the first time. This topped $250m over the period while Social Media advertising generated $24.3m.
The new revenue report provides deeper insight into the detail of how Interactive revenue in New Zealand is shared across devices and channels. It will be valuable to track performance trends across the spectrum in future reports.
With the first six months under its belt, IABNZ expects full year revenue to reach $996m by the end of the 2017.
Share this Post