Now into its second year, the IABNZ’s Internet Advertising Revenue Report – out yesterday – is able to show year-on-year comparisons, revealing that Desktop still leads the way but Mobile across NZ publishers is gaining, as Interactive Advertising reported in Q1 2018 reached $244.5m.
IABNZ’s Internet Advertising Revenue Report is a survey conducted independently by Staples Rodway is released each quarter. The results reported are considered the most accurate measurement of online advertising revenues since the data is compiled directly from information supplied by companies selling advertising online.
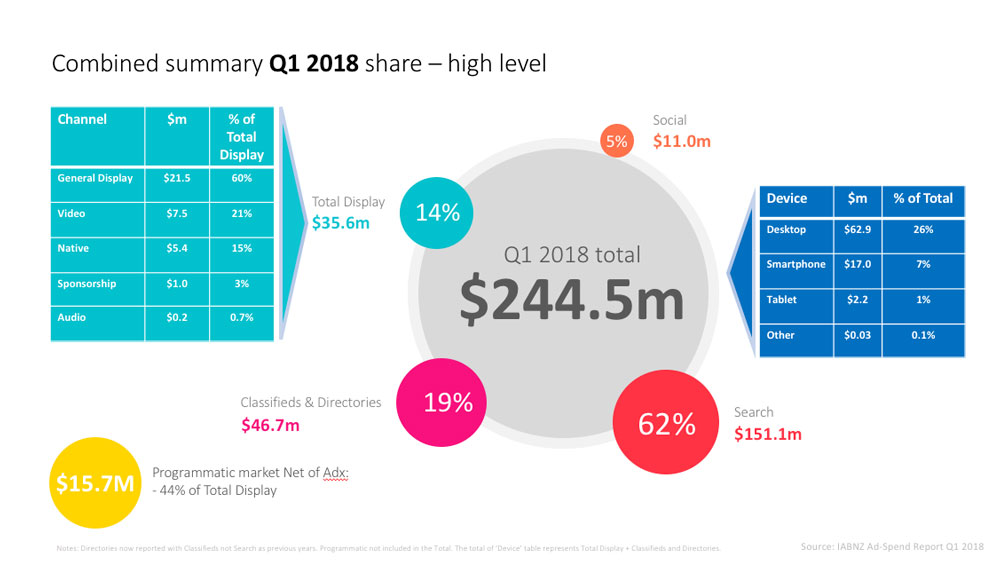
All-inclusive, the report includes data reflecting online advertising revenues from Web sites, commercial online services, as well as other companies selling online advertising.
The report filters revenue by device-type, that is, by mobile, desktop and tablet. An ‘Other’ category has also been included to capture revenue associated with smart TV apps, gaming consoles, wearables etc.
Each device-category is broken down into channels including general display; video, audio; sponsorship and native.
Programmatic Advertising revenue figures are now sourced from Standard Media Index (SMI). The reported revenue reflects the value of actual placements as reported by Agency Trading Desk bookings and bookings onto independent DSPs. The number reported is net of Google Ad Exchange.
“With a run rate like this, 2018 is looking like a record year in New Zealand.”
Social Media and Search collection methodologies remain unchanged to last year. These figures are not included in the device and channel analysis.
Desktop Display revenue generated $62.9m (26%) of the grand total with Classifieds & Directories the largest channel on desktop with $42.7m (67%). The total of mobile devices (smartphone, tablet and other) generated $19.54m, 8% of revenue across these three channels and achieved 50% year-on-year growth.
Smartphone revenue reached $17m or 6% of total revenue and 65% year-on-year growth. The Smartphone revenue reported reflects revenue generated by NZ publishers and is net of Search and Social.
- Across all devices, Total Display advertising revenue landed at $35.7m with General Display advertising reaching $21.5m a 2% year-on-year increase.
- Video generated just short of $7.5m over the period a 15% year-on-year increase.
- 3% ($1m) made up the Sponsorship category down 9% while Native contributed $5.4m to the Display number up 91% year-on-year.
- Programmatic Revenue (net of Google Ad Ex) realized $15.7m in Q1 (44% of Display Revenue). The Association of National Advertisers (ANA) in the US estimates that around 40% of revenue booked programmatically is finally attributed to media owners. Using this benchmark some $6.2m of programmatic spend can be attributed to NZ publishers.
- The Search category topped $151.1m in the quarter and now forms 62% of total revenue.
- As reported by SMI, social media revenue captured by NZ media agencies reached $11m in Q1 (5% of total revenue)
A record year?
“With a run rate of $245m per quarter, 2018 is looking like a record year,” says IABNZ ceo Adrian Pickstock.
Share this Post