NEW YORK, Wednesday: global media advertising markets – including NZ – are averaging a 28.2% decline in advertising expenditure in the “first wave” of the Covid-19 pandemic, according to expert data analysis by Standard Media Index.
SMI, which collects and publishes media agency payment ad pend data, based the analysis on its collection of advertising payment data from its multinational and independent media agency partners in the US, UK, Australian, New Zealand and Canadian markets from the start of the pandemic in March to the end of May.
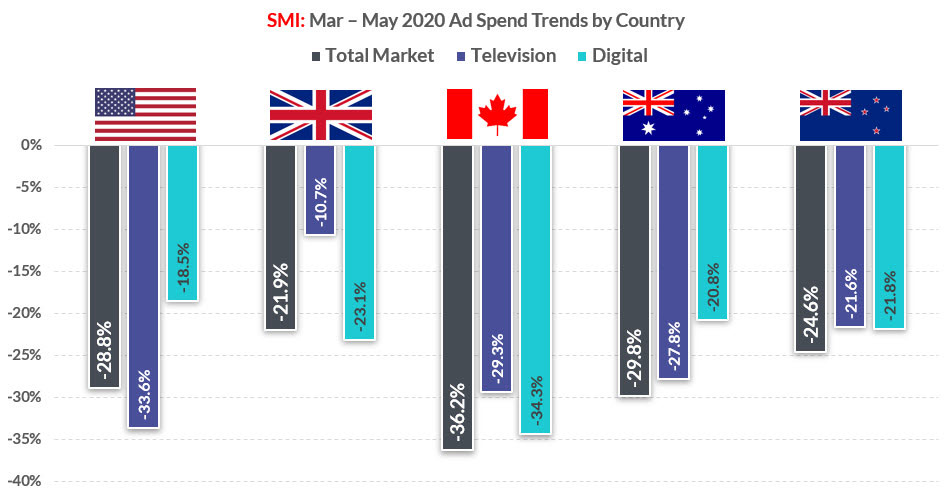
SMI global ceo James Fennessy said that while the actual levels of decline varied by 14.3% across the five markets, the one common factor was that all markets reported record adspend declines in the three-month period.
“This global pandemic is having an impact on advertising markets which is far more severe than what we ever reported during the 2008/9 global financial crisis when the size of the year-on-year declines being reported each month never reached more than 16%,” he said.
“So this has been an unfortunately unique experience given the sheer size of the adspend declines being reported. The fact the average decline is an extraordinary 28.2% really highlights the level of devastation wrought on some of the media markets where we track adspend.”
Fennessy said the largest three-month decline has been in Canada where total national marketer adspend fell 36.2% over the Mar-May 2019 period while the lowest decline has been in the UK where the total is back 21.9%.
“The value of travel advertising bookings fell 78% in the US, 61% in the UK and Australia, 65% in Canada and 76% in NZ.”
“The other similarity across each of these markets is that the TV and digital media are the largest in terms of share of national marketer spending, but a key take-out from our analysis is that the levels of decline are not consistent despite these media featuring numerous global media groups.
“The data highlighted the difficulty large advertisers and media companies have in tracking adspend across multiple media markets as the trends varied by country.
“There are many aspects of the global media industry which are similar – for example some reality style TV content formats translate across markets – but it’s a very different situation when it comes to advertising as there’s no consistency on how product categories move spend across media verticals.
“A good example is that in this three-month period insurance companies reduced their investment on US TV by 9.7% but in Australia we saw them grow their TV investment by 3.1%.
“The data really highlights the degree to which these mostly large multinational corporates are tailoring their media investments according to the local markets.”
Similarly, SMI’s data tracks the varying adspend trends across key digital sectors such as programmatic, search and social across countries.
“We can see continuing declines in programmatic adspend through this crisis in the US and Australian markets, but this form of digital advertising is continuing to at least grow share in the UK and NZ digital media,” Fennessy said.
“And again we can see different product categories driving those programmatic trends in each of those markets.
“Digital advertising is continuing to at least grow share in the UK and NZ digital media.”
“It is also interesting to note the varying category trends across each media market as growth in technology-related categories was evident in the Covid period in NZ, Australia and the UK while in the US the pharmaceutical category was the only significant market to report higher media investment.
“But it is clear there’s one category with universal declines in adspend and that’s of course the travel market, with the value of travel category advertising bookings falling 78% in the US, 61% in the UK and Australia, 65% in Canada and 76% in NZ. In every market, the loss of such a vibrant category has severely impacted many media.
“But there is good news, with SMI’s data in all countries showing strengthening advertising demand in June with the US emerging as one of the best performing markets with the value of ad spend falling just 20%.
“The key message here is that the advertising markets are moving off the bottom and are beginning to rebuild. SMI will continue to work with our subscribers and agency partners to help them move through the changing media landscape and grow as the media world tries to return to a new normal,” Fennessy said.
About SMI
Standard Media Index is a trusted source of advertising pricing and spend data in the marketplace. SMI accesses actual invoices from the world’s largest media buying groups, as well as leading independents, and then organises that data to create a clear, granular, and easy-to-use database for clients and agency partners. Our data supports insights covering 32 countries.
Methodology
SMI sources its data from the raw invoices from major media agency holding groups to see the actual dollar amounts spent on each ad buy. Using SMI real prices paid on spots, and combining that with occurrence data from Nielsen Ad Intel, SMI models out the full 100% of the spots in the TV marketplace within Nielsen’s coverage.
Share this Post